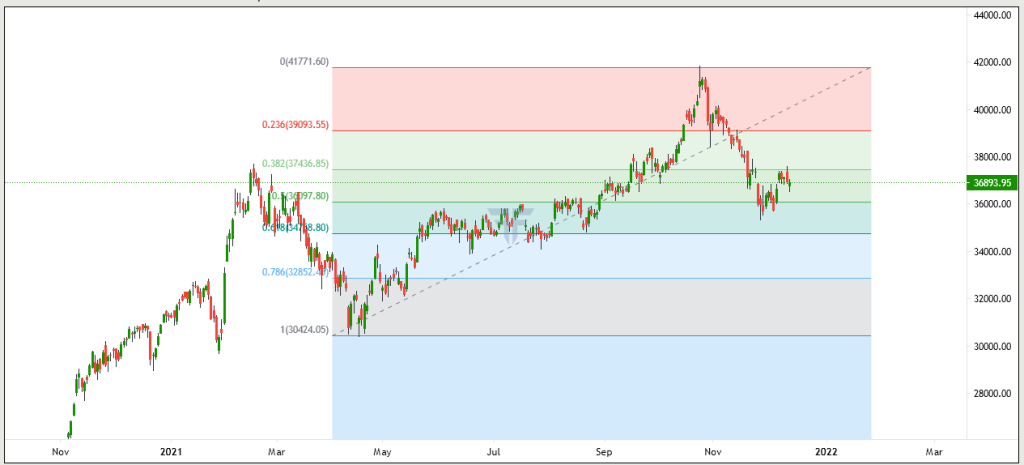
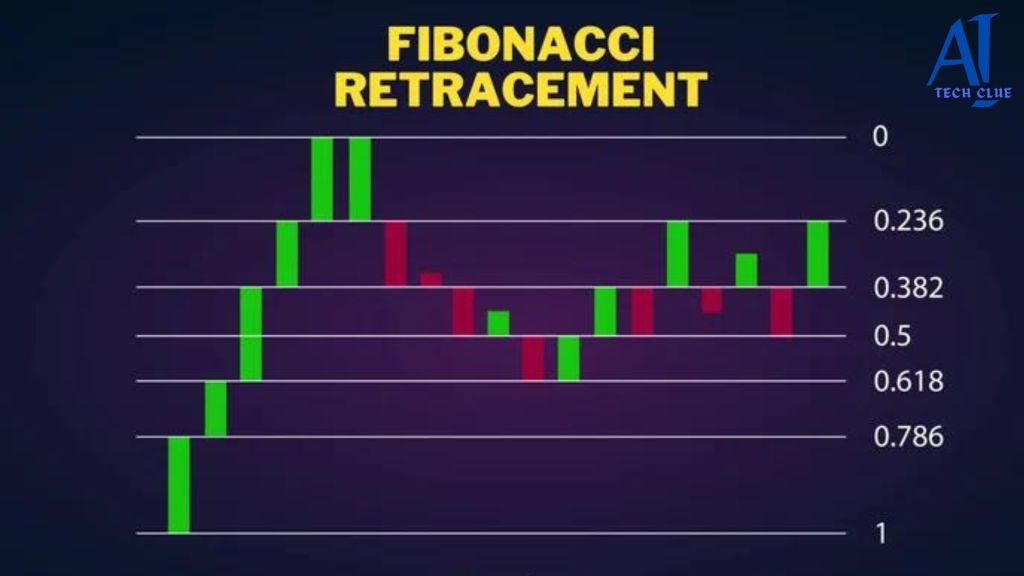
Fibonacci retracement is a popular tool used by traders to predict potential reversal points in a market trend. It is based on the Fibonacci sequence, a series of numbers where each number is the sum of the two preceding ones. Traders apply Fibonacci retracement levels to charts to find areas where the price of an asset might pull back before resuming its trend. Sounds simple, right? But there’s a deeper reason behind why it works.
The importance of Fibonacci numbers in trading lies in their mathematical connection to the “Golden Ratio” (approximately 1.618), which appears repeatedly in nature, art, and, surprisingly, in financial markets. This mathematical phenomenon can help traders make better decisions, but it requires a solid understanding of how to apply it.
If you want to read same article in hindi click here
The Basics of Fibonacci Retracement
Fibonacci retracement levels are horizontal lines that indicate where support and resistance are likely to occur. These levels are derived from the Fibonacci sequence and are commonly found at 23.6%, 38.2%, 50%, 61.8%, and 100%. These percentages represent how much of a prior move the price has retraced before it continues in the original direction.
Why do these levels matter? Many traders believe that markets tend to pull back to these Fibonacci levels before continuing in the same direction, making them a useful tool for identifying potential buy or sell opportunities.
How Fibonacci Retracement is Used in Technical Analysis
One of the main benefits of Fibonacci retracement is that it helps traders identify potential reversal points. These points can signal a temporary pullback or even a complete reversal in a trend. However, Fibonacci retracement should not be used in isolation. Successful traders often combine it with other technical indicators like moving averages, trend lines, or RSI (Relative Strength Index) to confirm their analysis.
For instance, if a stock is in an uptrend and pulls back to a key Fibonacci level (e.g., 38.2%), traders may look for a bullish candlestick pattern or increased buying volume to confirm that the trend is likely to continue.
The Fibonacci Sequence and Its Mathematical Background
The Fibonacci sequence starts with 0 and 1, and each subsequent number is the sum of the two preceding numbers: 0, 1, 1, 2, 3, 5, 8, 13, 21, and so on. This sequence has a unique property: the ratio of successive Fibonacci numbers tends to converge towards the Golden Ratio (1.618).
In trading, this ratio and its derivatives (e.g., 0.618, 1.618) are crucial for identifying potential support and resistance levels, making it a powerful tool for technical analysis.
Fibonacci Retracement Levels Explained

23.6% Level: Minor Corrections
This level often represents a shallow pullback. Traders consider this level for minor corrections in a strong trend.
38.2% Level: Standard Correction Point
The 38.2% level is more commonly observed and indicates a healthy retracement in a trending market.
50% Level: Midpoint
While not a true Fibonacci number, the 50% retracement level is significant psychologically and is widely used by traders.
61.8% Level: Golden Ratio Level
This is the most critical Fibonacci level for traders. The 61.8% retracement level is often where the most significant reversals occur.
100% Level: Complete Retracement
This level indicates a full retracement of the move, meaning the asset has returned to its starting price.
How to Calculate Fibonacci Retracement Levels
Calculating Fibonacci retracement levels involves identifying the high and low points of a price movement. Once these points are marked, you apply the Fibonacci percentages (23.6%, 38.2%, 50%, etc.) to the difference between the high and low to determine potential support and resistance levels.
For example, if a stock moves from $100 to $150, the difference is $50. To calculate the 38.2% retracement, multiply $50 by 0.382, which equals $19.10. Subtract this from the high ($150), and you get $130.90 as a potential support level.
Using Fibonacci Retracement in Forex Trading
In the forex market, Fibonacci retracement is a widely used tool because of its ability to identify potential areas of support and resistance. Forex traders use these levels to predict where a currency pair might find a temporary bottom or top. By combining Fibonacci retracement with other tools like pivot points or moving averages, forex traders can enhance their analysis.
Fibonacci Retracement in Stock Trading
Stock traders often use Fibonacci retracement to determine where a stock might pull back before continuing in the direction of the trend. This can be helpful in determining entry points, especially after a strong rally. Traders look at historical price movements and apply Fibonacci retracement levels to find where the stock may find support or resistance.
Common Mistakes When Using Fibonacci Retracement
While Fibonacci retracement is powerful, it’s not without its pitfalls. One common mistake is relying solely on Fibonacci retracement without considering other technical indicators or market conditions. Another is the incorrect identification of the start and end points of a trend, which can lead to inaccurate retracement levels.
How to Combine Fibonacci Retracement with Other Tools
To maximize the effectiveness of Fibonacci retracement, it’s best to use it in combination with other technical tools. For example, combining Fibonacci with moving averages can provide a more comprehensive view of potential price movements. Similarly, using Fibonacci retracement alongside RSI or candlestick patterns can help confirm whether a retracement level will hold.
Advantages of Using Fibonacci Retracement in Trading
Fibonacci retracement is easy to use and provides valuable insight into potential price levels. Its versatility across different markets—stocks, forex, cryptocurrencies—makes it a go-to tool for traders. Additionally, it helps identify potential entry and exit points, which is crucial for profitable trading.
Disadvantages of Fibonacci Retracement
Despite its benefits, Fibonacci retracement has some limitations. One of the biggest is its subjectivity—choosing the correct high and low points of a trend can vary between traders. Another downside is that it shouldn
’t be used in isolation; Fibonacci retracement works best when combined with other tools.
Real-Life Examples of Fibonacci Retracement in Action
Case Study 1: Stock Market Analysis
In a strong bull market, a stock retraced to the 38.2% level before continuing its upward trajectory, offering a perfect entry point for traders.
Case Study 2: Forex Trading Using Fibonacci Retracement
A currency pair retraced to the 61.8% level before bouncing back, confirming the continuation of its trend and providing a profitable trade setup.
Fibonacci Retracement vs Fibonacci Extension
While Fibonacci retracement is used to predict potential reversal points, Fibonacci extension is used to predict where the price might go after the retracement. Traders use extension levels to project future price targets, especially during strong trends.
Conclusion
Fibonacci retracement is an essential tool for traders, providing valuable insights into potential reversal points. When used correctly and in combination with other tools, it can enhance trading strategies and improve decision-making. However, like all tools, it’s essential to practice and refine your use of Fibonacci retracement to become proficient.
How to Use the MACD Indicator in Stock Trading
FAQs
- What is the most important Fibonacci level?
The 61.8% level, known as the Golden Ratio, is often considered the most important. - Can Fibonacci retracement be used in cryptocurrency trading?
Yes, many traders use Fibonacci retracement to analyze cryptocurrency price movements. - How do I use Fibonacci retracement in day trading?
Identify the high and low points of the day and apply Fibonacci levels to find potential intraday reversal points. - Is Fibonacci retracement reliable in all market conditions?
It is most reliable in trending markets but less so in sideways or choppy markets. - Can Fibonacci retracement predict the future price?
No, Fibonacci retracement helps identify potential support and resistance levels but does not predict future prices.

