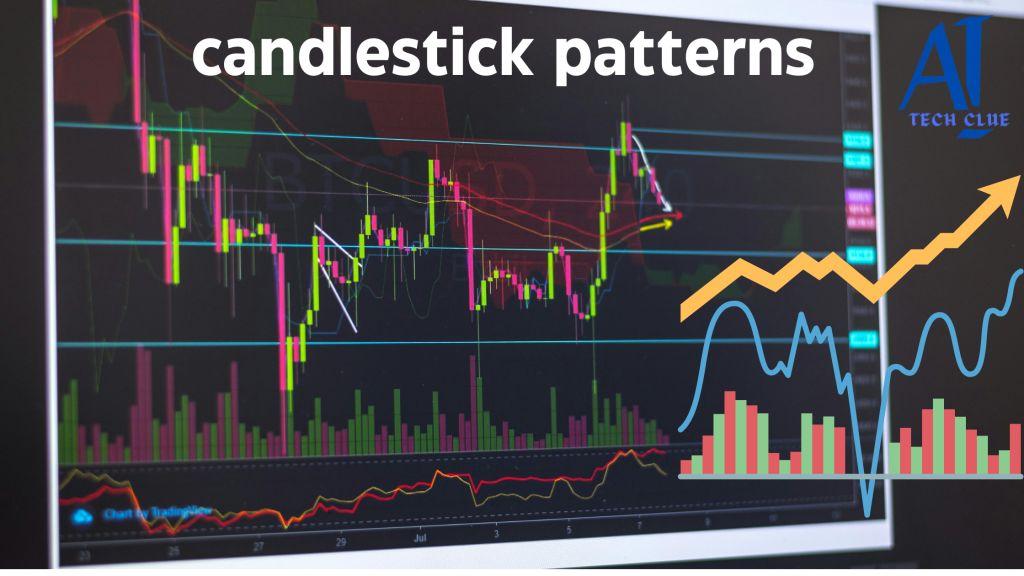
Candlestick patterns are essential tools for technical analysis in trading, used by traders to predict potential price movements based on past market behavior. They provide a visual representation of price action for a specific period and can signal trend reversals, continuations, and potential entry or exit points.
In this article, we’ll explore what candlestick patterns are, how they work, and how you can use them in your trading strategy.
If you want to read same article in hindi click here
What Are Candlestick Patterns?
Candlestick patterns are chart formations created by one or more candlesticks that provide insights into market sentiment. A single candlestick shows four key pieces of data for a given time period:
- Opening price
- Closing price
- Highest price (high)
- Lowest price (low)
The body of the candlestick represents the range between the opening and closing prices, while the wicks (also known as shadows) show the highest and lowest points reached during that time period.
Why Are Candlestick Patterns Important?

Candlestick patterns are crucial for traders because they provide visual cues about market sentiment and momentum. By interpreting these patterns, traders can make more informed decisions about when to enter or exit trades. Candlestick patterns can indicate:
- Trend reversals: A change in the current market direction (bullish to bearish or vice versa).
- Trend continuations: Confirmation that the current trend is likely to continue.
- Indecision in the market: When buyers and sellers are equally matched, causing little movement in price.
Basic Structure of a Candlestick
Each candlestick has two main components:
- Body: The colored section representing the range between the opening and closing prices.
- Wicks (Shadows): The thin lines extending above and below the body, showing the high and low prices during the time period.
If the closing price is higher than the opening price, the candle is typically green or white (bullish). If the closing price is lower, it’s usually red or black (bearish).
Types of Candlestick Patterns
There are various candlestick patterns, but they can generally be categorized into two groups: bullish and bearish. Here are some of the most popular patterns used by traders:
Bullish Candlestick Patterns
1. Hammer
- What it looks like: A small body with a long lower wick and little to no upper wick.
- What it signals: The hammer pattern suggests a potential bullish reversal after a downtrend. It shows that despite selling pressure during the session, buyers pushed the price back up by the close.
2. Bullish Engulfing
- What it looks like: A small bearish candle followed by a larger bullish candle that “engulfs” the previous one.
- What it signals: This pattern indicates a reversal of the current downtrend, as buying pressure overwhelms selling pressure.
3. Morning Star
- What it looks like: A bearish candle, followed by a small candle (indecision), and then a large bullish candle.
- What it signals: This pattern suggests a reversal of a downtrend, often seen as a strong indicator of a new upward trend.
4. Piercing Line
- What it looks like: A large bearish candle followed by a bullish candle that closes above the midpoint of the first.
- What it signals: A bullish reversal, as the second candle shows buyers are gaining control after a period of selling.
Bearish Candlestick Patterns
1. Shooting Star
- What it looks like: A small body with a long upper wick and little to no lower wick.
- What it signals: The shooting star signals a bearish reversal after an uptrend, showing that buyers drove the price up but sellers pushed it back down.
2. Bearish Engulfing
- What it looks like: A small bullish candle followed by a larger bearish candle that “engulfs” the previous one.
- What it signals: This pattern suggests a reversal of the current uptrend, with selling pressure overtaking buying pressure.
3. Evening Star
- What it looks like: A bullish candle, followed by a small indecisive candle, and then a large bearish candle.
- What it signals: A bearish reversal, indicating that the market may start trending downward after a period of upward movement.
4. Dark Cloud Cover
- What it looks like: A bullish candle followed by a bearish candle that closes below the midpoint of the first.
- What it signals: This pattern shows that sellers are gaining control after an uptrend, suggesting a potential reversal.
How to Use Candlestick Patterns in Trading
Candlestick patterns are best used in combination with other technical analysis tools to increase their effectiveness. Here’s how you can integrate them into your trading strategy:
1. Identify the Trend
Candlestick patterns are more powerful when used within the context of a larger trend. Always identify the current trend (uptrend, downtrend, or sideways) before making trading decisions.
2. Confirm with Other Indicators
While candlestick patterns are useful, they’re not foolproof. Always confirm the signals with other technical indicators, such as:
- Moving Averages: To confirm trend direction and strength.
- Relative Strength Index (RSI): To identify overbought or oversold conditions.
- Volume: To see whether the price movement is backed by strong buying or selling pressure.
3. Use Risk Management
Like any other trading strategy, candlestick patterns aren’t guaranteed to work every time. Always implement risk management techniques, such as:
- Setting stop-loss orders: To limit potential losses if the trade goes against you.
- Position sizing: Only risking a small percentage of your capital on each trade.
4. Avoid Overtrading
One of the most common mistakes traders make is trying to trade every candlestick pattern they see. Not every pattern is significant, so focus on high-probability setups.
Advantages and Limitations of Candlestick Patterns
Advantages
- Easy to interpret: Candlestick patterns offer a simple, visual way to understand market sentiment.
- Widely used: Many traders use these patterns, which can make them self-fulfilling in certain cases.
- Versatile: Can be applied across different time frames and asset classes.
Limitations
- Not always accurate: Candlestick patterns can produce false signals, especially in choppy markets.
- Need for confirmation: Patterns are most effective when combined with other forms of analysis.
- Subjectivity: Interpretation of patterns can vary between traders.
Conclusion: Mastering Candlestick Patterns
Candlestick patterns are an essential tool for traders looking to analyze price action and make informed decisions. While they can provide valuable insights into market trends and potential reversals, it’s important to remember that no pattern is 100% reliable. By combining candlestick patterns with other technical indicators and employing sound risk management, you can enhance your trading strategy and improve your chances of success.
How to Use Moving Averages in Technical Analysis
FAQs
1. What is the best time frame to use candlestick patterns?
Candlestick patterns can be used on any time frame, but daily and weekly charts tend to provide more reliable signals.
2. Can candlestick patterns be used for all asset classes?
Yes, candlestick patterns can be applied to stocks, forex, commodities, and cryptocurrencies.
3. Are candlestick patterns more effective in trending markets?
Yes, candlestick patterns are most effective when used within the context of a strong trend.
4. Can I rely solely on candlestick patterns for trading?
It’s not advisable to rely solely on candlestick patterns. They should be used in conjunction with other technical indicators.
5. How long does it take to learn candlestick patterns?
The time it takes to master candlestick patterns varies, but with consistent practice, you can become proficient within a few months.


1 thought on “Candlestick Patterns in Trading”