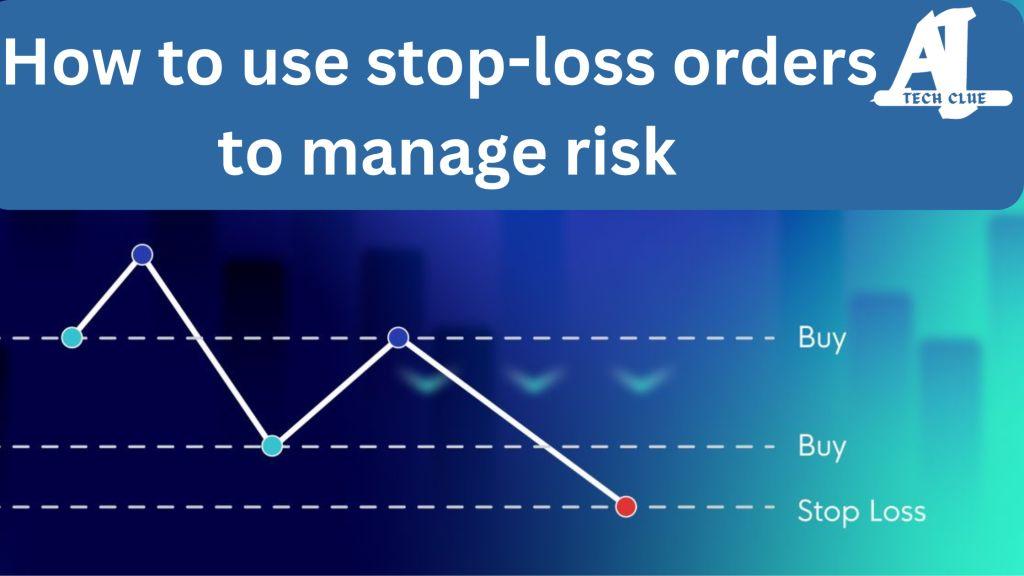
How to Use Stop-Loss Orders to Manage Risk

Use Stop-Loss Orders to Manage Risk

Introduction to Stop-Loss Orders When it comes to investing in the stock market, one of the biggest concerns for investors is how to manage risk. The stock market is unpredictable, and even the most well-researched investments can experience downturns. So, how do you protect your capital when things go wrong? That’s where stop-loss orders come … Read more

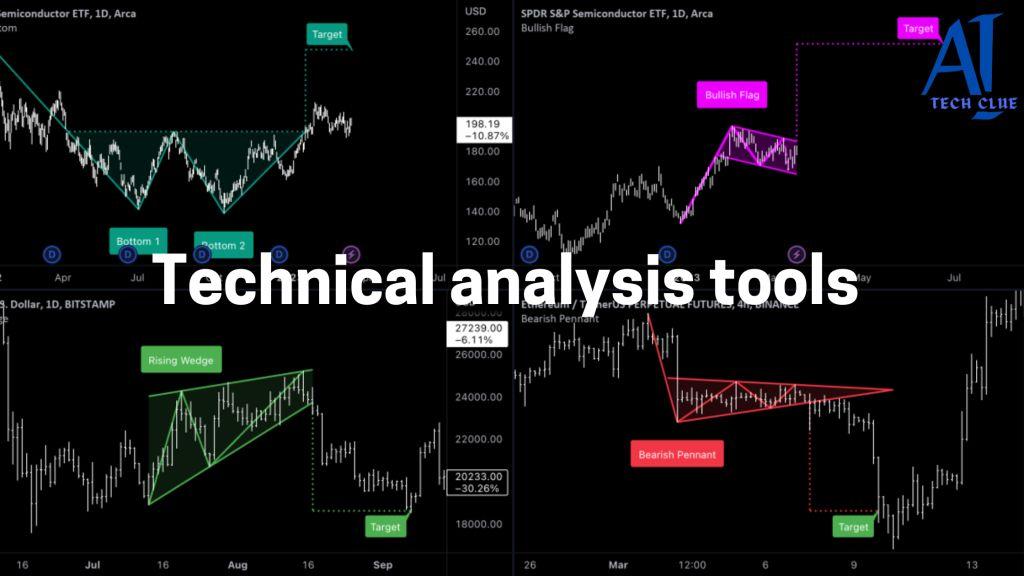
Technical Analysis Tools Every Trader Should Know

Technical Analysis Tools Every Trader Should Know

Introduction to Technical Analysis Tools When it comes to trading, be it stocks, forex, or cryptocurrencies, one of the most valuable approaches traders use is technical analysis. By leveraging different tools and indicators, traders can identify trends, potential price reversals, and ideal entry and exit points. In this article, we will explore the essential technical … Read more

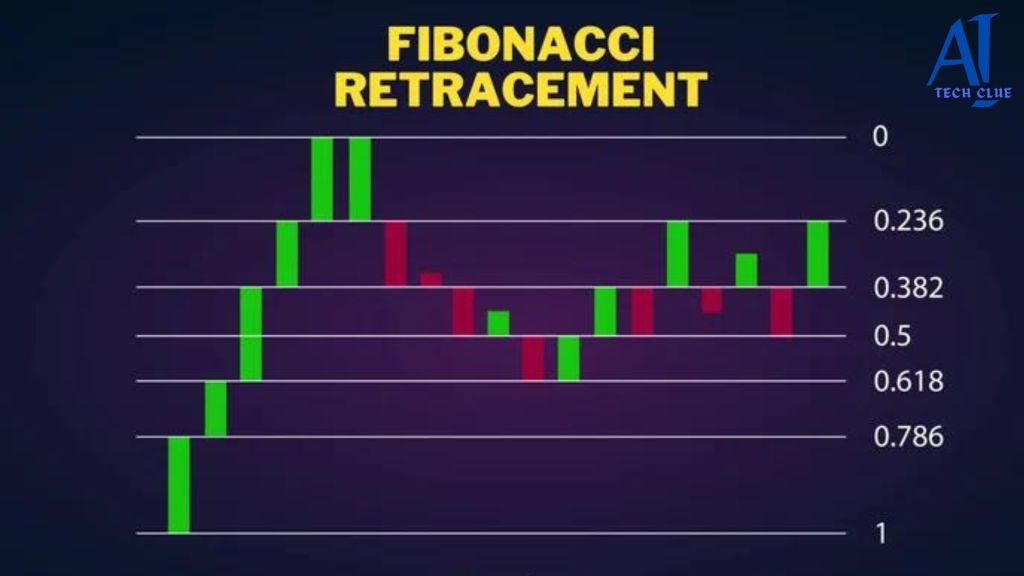
What is Fibonacci retracement and how to apply it in trading

What is Fibonacci Retracement

Fibonacci retracement is a popular tool used by traders to predict potential reversal points in a market trend. It is based on the Fibonacci sequence, a series of numbers where each number is the sum of the two preceding ones. Traders apply Fibonacci retracement levels to charts to find areas where the price of an … Read more

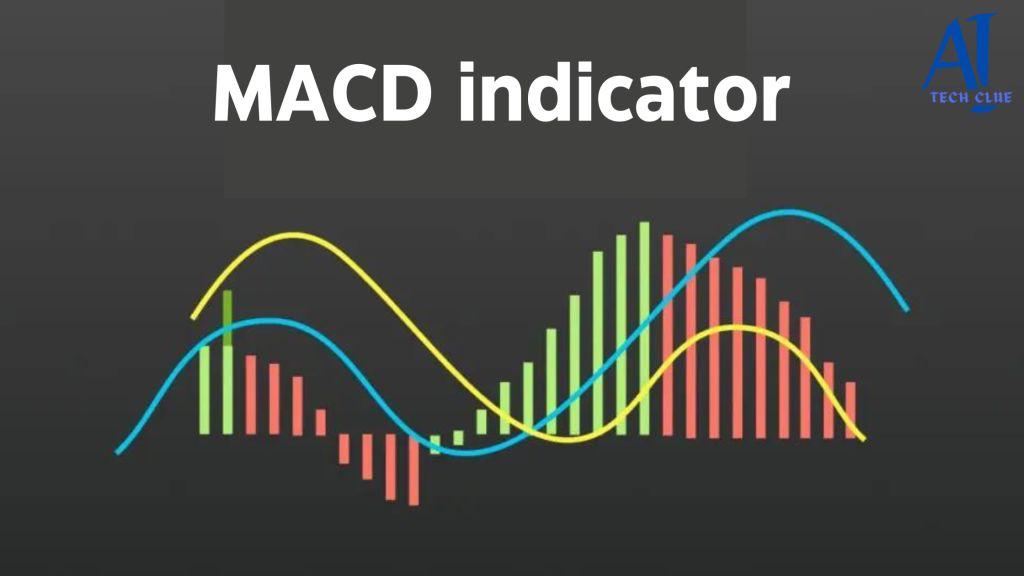
How to Use the MACD Indicator in Stock Trading

How to Use the MACD Indicator

How to Use the MACD Indicator in Stock Trading Introduction to the MACD Indicator in Stock Trading The MACD indicator, short for Moving Average Convergence Divergence, is one of the most popular tools among stock traders. But why is it so widely used? Simply put, it helps traders spot potential buying or selling opportunities by … Read more

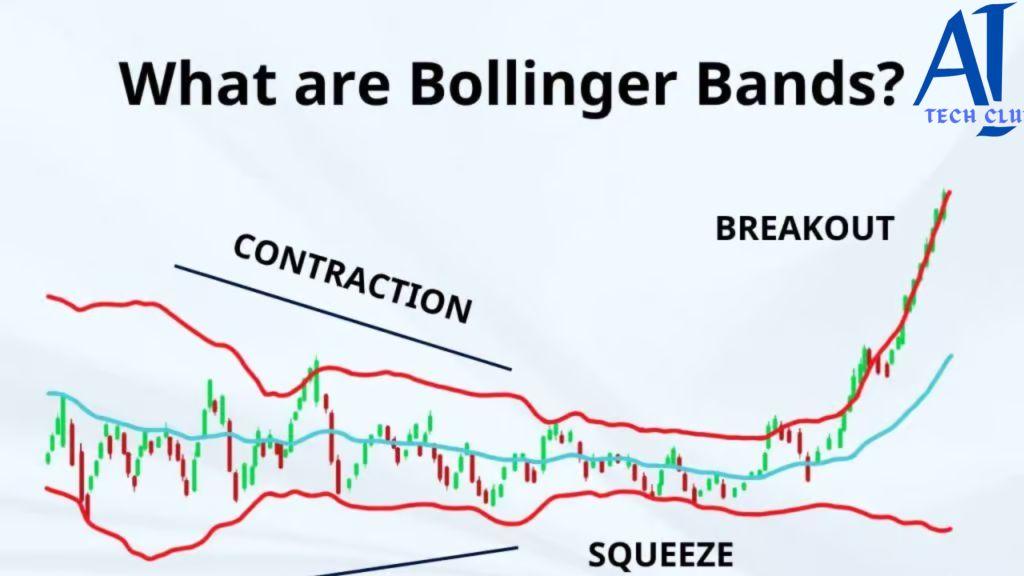
Understanding Bollinger Bands and Their Application

Understanding Bollinger Bands

Introduction to Bollinger Bands In the world of trading, Bollinger Bands are one of the most widely used technical analysis tools. Whether you’re a seasoned trader or just dipping your toes into the market, understanding how Bollinger Bands work can provide you with key insights into market trends, volatility, and potential breakouts. If you want … Read more

How to Use the Relative Strength Index (RSI) for Trading Signals

Relative Strength Index (RSI) for Trading Signals

When it comes to technical analysis in trading, the Relative Strength Index (RSI) is one of the most commonly used indicators. Traders often rely on RSI to understand whether an asset is overbought or oversold, and to identify potential reversals in trends. It’s a powerful tool that can help traders make well-timed entry and exit … Read more

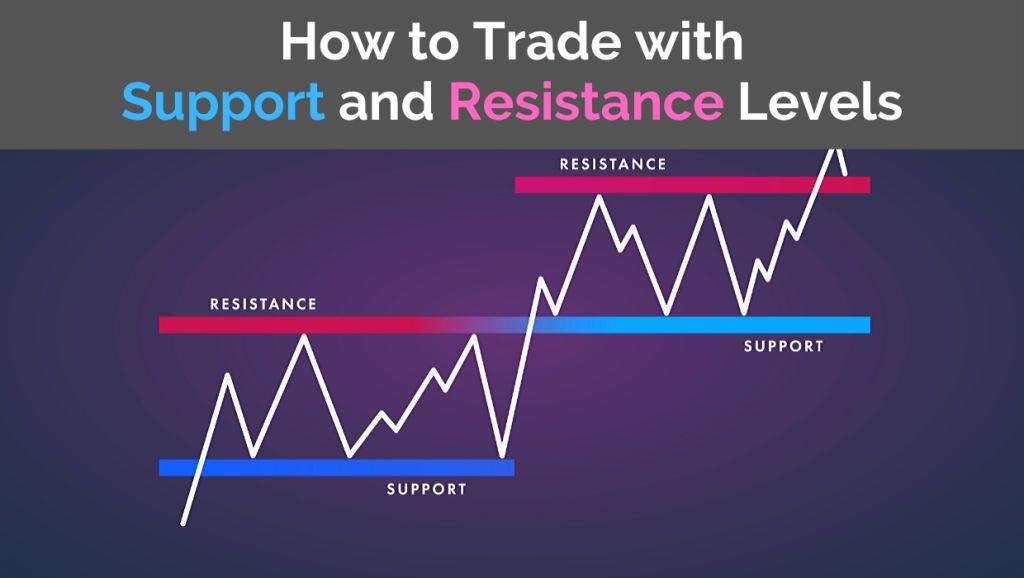
What Are Support and Resistance Levels in Trading?

Support and Resistance Levels in Trading

When it comes to stock trading, two of the most fundamental concepts traders rely on are support and resistance levels. These concepts help traders understand price movements and predict potential turning points in the market. Whether you’re a beginner or a seasoned trader, mastering these concepts can give you an edge in the stock market. … Read more

How to Use Moving Averages in Technical Analysis

Moving Averages in Technical Analysis

Introduction In the world of trading and investing, technical analysis is a widely used method to predict future price movements by studying past market data. One of the most important tools within technical analysis is the moving average (MA). Whether you’re a day trader or a long-term investor, moving averages can help you smooth out … Read more

Candlestick Patterns in Trading

candlestick patterns

Candlestick patterns are essential tools for technical analysis in trading, used by traders to predict potential price movements based on past market behavior. They provide a visual representation of price action for a specific period and can signal trend reversals, continuations, and potential entry or exit points. In this article, we’ll explore what candlestick patterns … Read more

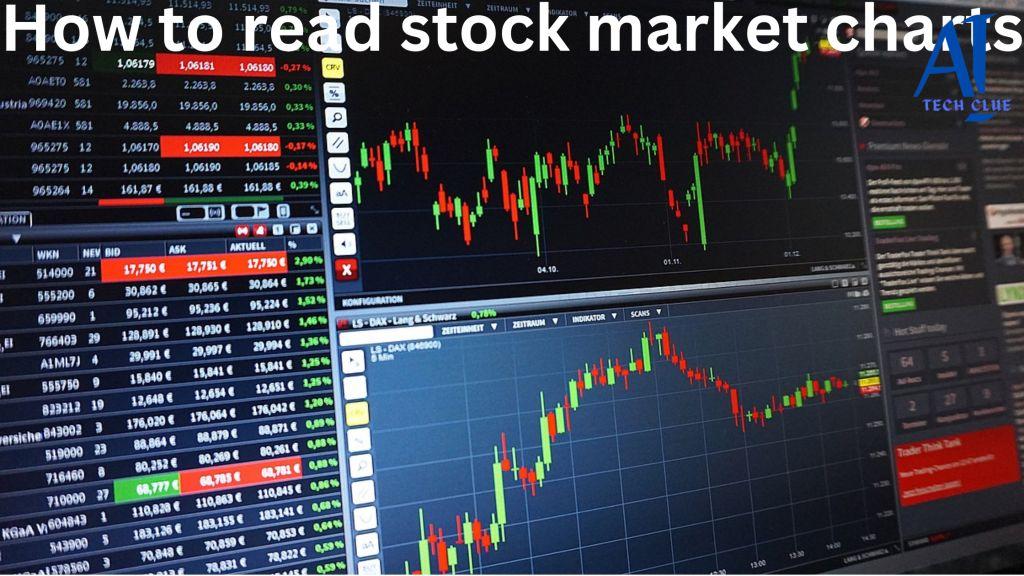
How to Read Stock Market Charts: A Beginner’s Guide

stock market charts

When you first dive into the stock market, stock charts might look like confusing webs of lines, bars, and numbers. But fear not! With some basic knowledge, you can start making sense of these charts and use them to inform your trading decisions. This beginner’s guide will walk you through how to read stock market … Read more