Introduction to the Sharpe Ratio
In the world of investing, balancing risk and reward is crucial. How do you know if an investment is worth the risk? This is where the Sharpe Ratio comes in. Named after Nobel laureate William F. Sharpe, this ratio helps investors understand how much return they’re getting for the amount of risk they’re taking. By evaluating risk-adjusted returns, the Sharpe Ratio becomes an essential tool for investors who want to maximize their returns while minimizing unnecessary risks.
If you want to read same article in hindi click here
What is the Sharpe Ratio?
The Sharpe Ratio is a financial metric used to measure the performance of an investment compared to its risk. It shows how much excess return you’re earning for each unit of risk taken. In simpler terms, it’s a way to assess whether an investment’s returns are due to smart investing or just taking on more risk.
The Formula Explained
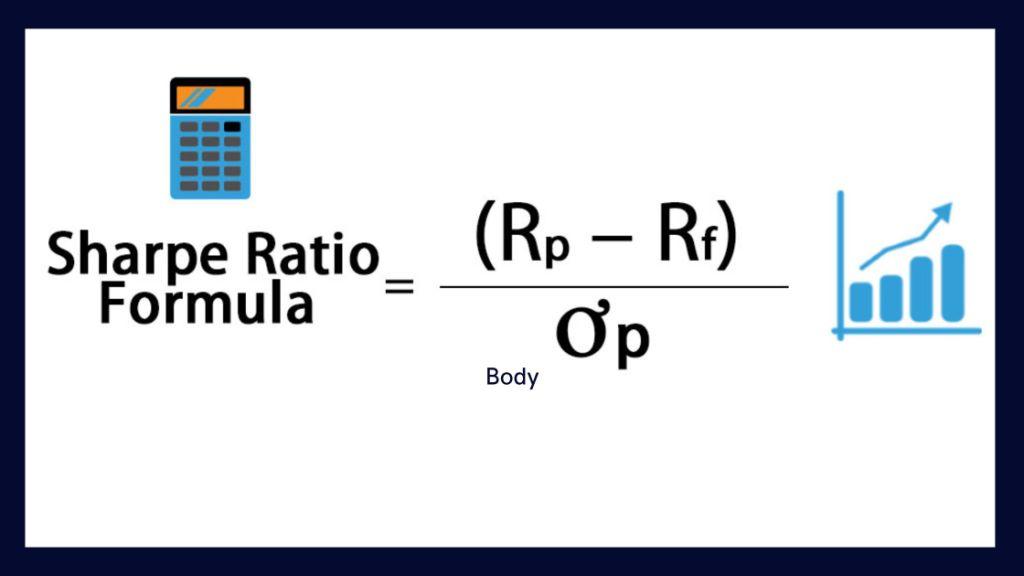
The Sharpe Ratio is calculated using the following formula:
Sharpe Ratio = (Return of Investment – Risk-Free Rate) / Standard Deviation of the Investment
Components of the Sharpe Ratio:
- Return of Investment: The actual return earned from the investment.
- Risk-Free Rate: The return on a risk-free asset, like U.S. Treasury bonds, which serves as a benchmark.
- Standard Deviation: A measure of the investment’s volatility or risk. It indicates how much the returns deviate from the average return.
Understanding Risk-Adjusted Returns
Investors are always looking for returns, but they need to account for the risk involved. If two investments generate the same return, but one has much higher volatility, the one with lower volatility is preferable because it’s less risky. The Sharpe Ratio helps you see how much return you’re getting per unit of risk, offering a clearer picture of the quality of your investment performance.
How to Calculate the Sharpe Ratio
The Sharpe Ratio Formula
As mentioned earlier, the formula is:
Sharpe Ratio = (Return of Investment – Risk-Free Rate) / Standard Deviation
Steps to Calculate the Ratio:
- Find the average return of your investment over a period.
- Subtract the risk-free rate (such as the return on government bonds) from this return.
- Calculate the standard deviation of your investment returns to measure the volatility.
- Divide the difference between the investment return and the risk-free rate by the standard deviation.

Example Calculation
Let’s say an investment generates a return of 10% over a year, and the risk-free rate is 2%. If the standard deviation of the investment’s return is 8%, the Sharpe Ratio would be:
Sharpe Ratio = (10% – 2%) / 8% = 1.00
A Sharpe Ratio of 1.00 means you’re getting one unit of return for every unit of risk, which is considered decent.
Interpreting the Sharpe Ratio
What a High Sharpe Ratio Means
A high Sharpe Ratio (above 1) indicates that an investment has performed well relative to the amount of risk taken. The higher the Sharpe Ratio, the better the risk-adjusted performance.
What a Low Sharpe Ratio Means
A low Sharpe Ratio (below 1) suggests that the investment has a relatively poor return for the risk taken. In some cases, a negative Sharpe Ratio means that an investment is underperforming even compared to a risk-free asset.
The Limitations of the Sharpe Ratio
While a higher Sharpe Ratio is generally better, it’s important to remember that the metric relies heavily on past performance. It also assumes that returns are normally distributed, which may not always be the case in the real world.
The Sharpe Ratio vs Other Performance Metrics
Sharpe Ratio vs Treynor Ratio
While the Sharpe Ratio measures returns relative to total risk (using standard deviation), the Treynor Ratio only considers systematic risk (beta). The Sharpe Ratio is more useful when analyzing diversified portfolios, while the Treynor Ratio works well for individual securities.
Sharpe Ratio vs Sortino Ratio
The Sortino Ratio is a variation of the Sharpe Ratio that only considers downside risk (negative volatility). This makes it a better metric for investors who are primarily concerned with protecting against losses, as it focuses on the downside rather than overall volatility.
Which Metric is More Useful?
The Sharpe Ratio is ideal for comparing investments with similar risk profiles, while the Sortino Ratio may be better for investments with asymmetric risk. Both have their place, but the Sharpe Ratio is more widely used for general portfolio comparison.
Why is the Sharpe Ratio Important in Investing?
The Sharpe Ratio helps investors compare different assets based on their risk-adjusted returns. It’s particularly useful when evaluating mutual funds, ETFs, or portfolios, as it allows you to assess whether the higher returns of an investment are due to better performance or just higher risk.
The Sharpe Ratio in Different Asset Classes
Equities and the Sharpe Ratio
The Sharpe Ratio is commonly used to evaluate equity investments like stocks and stock-based mutual funds. Stocks tend to have higher volatility, so the Sharpe Ratio helps you understand whether the returns justify the risk.
Bonds and the Sharpe Ratio
Bonds typically have lower volatility compared to equities, so they often have a lower Sharpe Ratio. However, for conservative investors, a lower but positive Sharpe Ratio on bonds might still be attractive due to the reduced risk.
Alternative Investments (Real Estate, Commodities)
Alternative investments like real estate or commodities can have high volatility, but they also provide diversification. The Sharpe Ratio can help you determine whether these assets are adding value to your portfolio or just increasing your risk.
Practical Applications of the Sharpe Ratio in Portfolio Management
Using the Sharpe Ratio to Optimize Portfolios
Portfolio managers use the Sharpe Ratio to adjust their asset allocation. The goal is to maximize the Sharpe Ratio by balancing risk and return
, often leading to diversified portfolios that offer better risk-adjusted performance.
How Fund Managers Use the Sharpe Ratio
Mutual fund and hedge fund managers often compare their fund’s Sharpe Ratio to that of a benchmark (like the S&P 500) to show how well they’re managing risk. A fund with a higher Sharpe Ratio than the benchmark is seen as performing well.
Limitations of the Sharpe Ratio
One of the main limitations of the Sharpe Ratio is that it assumes returns follow a normal distribution. In reality, markets experience skewness and kurtosis (extreme events), which the Sharpe Ratio doesn’t account for. It also assumes that volatility is the only risk that matters, but in practice, other risks (like liquidity or credit risk) could be important.
Adjusting the Sharpe Ratio for Real-World Use
Adjusting for Different Risk Factors
In real-world investing, you may need to adjust the Sharpe Ratio to account for additional risks, like liquidity or currency risk. These factors can affect returns in ways the standard Sharpe Ratio doesn’t capture.
Accounting for Non-Normal Distributions
When returns are not normally distributed, alternative risk-adjusted measures like the Sortino Ratio may provide more accurate insights, as they better account for downside risks.
Sharpe Ratio in Modern Investment Strategies
How Hedge Funds Use the Sharpe Ratio
Hedge funds rely heavily on the Sharpe Ratio to measure performance, as they typically engage in complex strategies with varying risk levels. A high Sharpe Ratio is often used to attract investors.
Sharpe Ratio in Robo-Advisory Platforms
Many robo-advisors use algorithms to optimize portfolios based on risk-adjusted returns, making the Sharpe Ratio a key factor in their investment strategies. These platforms aim to provide portfolios with high Sharpe Ratios to appeal to risk-averse investors.
Examples of Sharpe Ratios for Well-Known Investments
Historically, major indices like the S&P 500 have had Sharpe Ratios between 0.5 and 1.0 over long periods. Well-managed mutual funds may have Sharpe Ratios higher than 1, indicating they are providing good returns for the risk taken.
Using the Sharpe Ratio to Compare Investments
Evaluating Mutual Funds
When choosing a mutual fund, comparing the Sharpe Ratios of different options can help you identify which ones offer better risk-adjusted returns. A higher Sharpe Ratio suggests a better balance between risk and return.
Assessing ETFs
Just like mutual funds, ETFs can be evaluated using the Sharpe Ratio. This helps investors pick ETFs that offer attractive returns without taking on unnecessary risk.
Conclusion
The Sharpe Ratio is a powerful tool that helps investors understand the relationship between risk and return in their portfolios. By providing a clear measure of risk-adjusted performance, it allows you to make more informed decisions, optimize your portfolio, and compare different investment options. However, like any metric, it’s important to use the Sharpe Ratio in conjunction with other tools and to be aware of its limitations, especially when dealing with real-world market conditions.
What is Quantitative Analysis in Stock Trading?
FAQs
1: What is a good Sharpe Ratio?
A Sharpe Ratio above 1 is considered good, indicating that the return is high relative to the risk taken. Ratios above 2 are excellent, while below 1 might suggest the risk is too high for the returns.
2: How often should I calculate the Sharpe Ratio for my portfolio?
It’s a good idea to calculate the Sharpe Ratio periodically, such as quarterly or annually, to keep track of how your investments are performing relative to risk.
3: Can the Sharpe Ratio predict future performance?
No, the Sharpe Ratio is based on historical data, so it can’t predict future performance. However, it helps assess the risk-adjusted performance of past investments.
4: What’s the difference between the Sharpe Ratio and the Sortino Ratio?
The Sortino Ratio only considers downside risk (negative volatility), making it more useful for investors who are focused on avoiding losses, whereas the Sharpe Ratio considers total risk.
5: Is the Sharpe Ratio useful for all types of investments?
The Sharpe Ratio works best for investments with normally distributed returns, like stocks or bonds, but it may not be as reliable for alternative investments with non-normal distributions.

