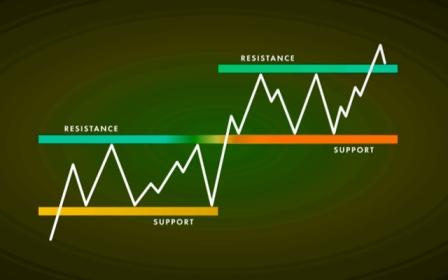
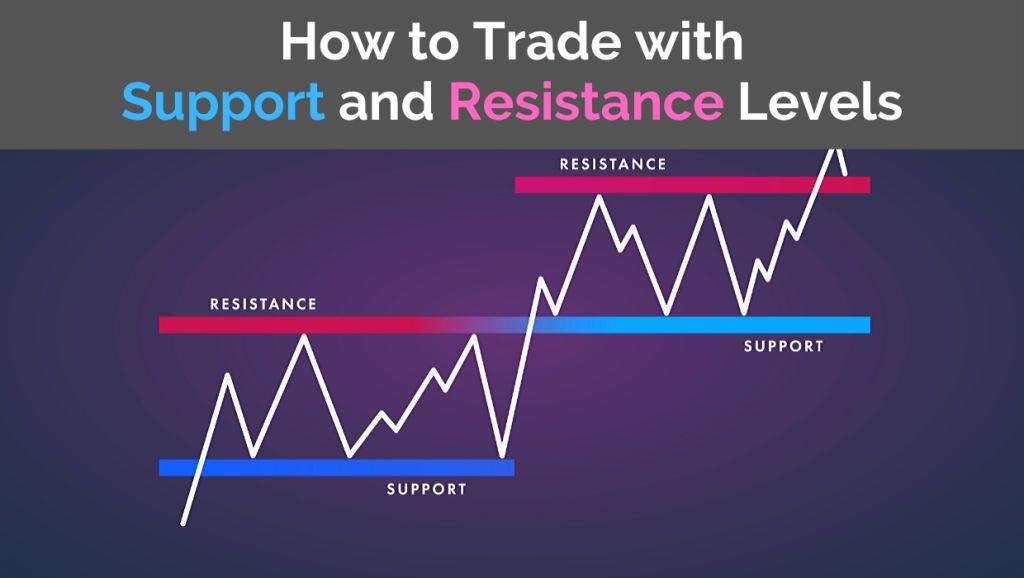
When it comes to stock trading, two of the most fundamental concepts traders rely on are support and resistance levels. These concepts help traders understand price movements and predict potential turning points in the market. Whether you’re a beginner or a seasoned trader, mastering these concepts can give you an edge in the stock market. But what exactly are support and resistance levels, and how do they work? Let’s break it down.
“Support and Resistance Levels in Trading” want to read in hindi click here
The Basics of Support Levels
Support levels in stock trading refer to a price point where a stock tends to stop falling and start bouncing back. Imagine a floor that prevents the stock price from dropping further. Traders use support levels to identify buying opportunities since it’s likely the stock will rise again after hitting that level.
Factors That Influence Support Levels
Several factors contribute to the formation of support levels. One of the primary factors is trading volume, which indicates the strength of a support zone. High trading volume at a particular price level shows increased interest from buyers. Market sentiment and historical price patterns also play a significant role in establishing support levels.
How to Identify Support Levels on a Chart
To spot support levels, traders use tools like moving averages, trend lines, and psychological price points (such as round numbers like $100). These tools help visualize where the stock price has repeatedly stopped falling. By analyzing past price movements, traders can forecast potential areas of support in the future.
Understanding Resistance Levels
If support is the floor holding up the stock price, resistance is the ceiling preventing it from going higher. Resistance levels are price points where stocks typically struggle to break through, causing the price to drop. Understanding resistance is essential for selling stocks at optimal prices.
Key Factors Influencing Resistance Levels
Just like support, resistance levels are influenced by market conditions such as volatility and price momentum. Additionally, external events like economic news or a company’s earnings report can cause a surge in stock prices, but they may still face resistance at certain levels.
Identifying Resistance Levels on a Chart
Traders often use trend lines, candlestick patterns, and technical indicators like the Relative Strength Index (RSI) to identify resistance levels. Watching for how the stock reacts to these levels over time can help traders predict potential sell opportunities.
Why Support and Resistance Levels Matter

Support and resistance levels are crucial because they help traders predict price reversals and market trends. By identifying these key levels, traders can make informed decisions about when to enter or exit a trade, which ultimately helps in risk management.
Support and Resistance in Different Market Conditions
Different markets demand different approaches. In a bullish market, traders may focus more on resistance levels as they seek optimal exit points. Conversely, in a bearish market, support levels become more critical as traders look for the price floors where buying pressure may build up.
Common Mistakes When Using Support and Resistance
One of the most common mistakes is over-reliance on a single support or resistance level. Stock prices are influenced by various factors, and placing all your trust in one level could lead to losses. Another mistake is ignoring the overall market context, which can alter how these levels behave.
How to Avoid These Mistakes
To avoid these errors, traders should combine support and resistance analysis with other tools, such as moving averages, Fibonacci retracements, and RSI indicators. It’s also essential to watch for confirmation signals, such as volume spikes, which can indicate whether a level will hold or break.
Advanced Techniques for Using Support and Resistance
For traders looking to refine their skills, advanced techniques like Fibonacci retracements and pivot points provide deeper insights into price movements. These methods calculate potential retracement levels based on past price swings, helping traders identify precise support and resistance points.
Using Multiple Time Frames to Strengthen Analysis
Analyzing multiple time frames (e.g., daily vs. weekly charts) helps traders get a more comprehensive view of stock trends. A support level on a daily chart may not appear on a weekly chart, and vice versa. Aligning time frames gives more reliable trading signals.
Trading Strategies Based on Support and Resistance
Many traders use range trading when stock prices bounce between support and resistance levels, buying at support and selling at resistance. Another popular strategy is breakout trading, where traders look for price breaks above resistance or below support for big moves.
Combining Indicators with Support and Resistance
For a more robust strategy, traders often combine support and resistance with other indicators like moving averages or RSI. This combination provides a clearer signal of market momentum and potential reversals, allowing for better decision-making.
Conclusion
In conclusion, support and resistance levels are essential tools for stock traders. They provide valuable insights into price movements and help traders make informed decisions about when to buy or sell. By incorporating these concepts into your trading strategy and combining them with technical indicators, you can improve your ability to predict market trends and manage risk effectively.
How to Use the Relative Strength Index (RSI) for Trading Signals
Frequently Asked Questions (FAQs)
1. What is the difference between support and resistance?
Support is the price level where a stock tends to stop falling, while resistance is the price level where it stops rising.
2. How often do support and resistance levels change?
They can change frequently, especially in volatile markets, as new data and trading activity shift price patterns.
3. Can support and resistance levels be used for long-term trading?
Yes, they are effective for both short-term and long-term trading, though long-term traders often use weekly or monthly charts.
4. What happens when a support or resistance level is broken?
When a level is broken, it may signal a strong trend in that direction, often leading to significant price movements.
5. Is it possible to trade without using support and resistance levels?
While possible, many traders find it challenging to trade effectively without these levels, as they provide critical insights into price action.

