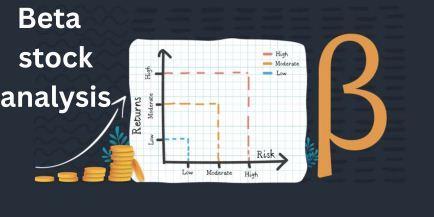
Introduction to Beta in Stock Analysis
Beta is one of the most widely used metrics in stock analysis, particularly for understanding how much risk a stock carries in relation to the broader market. It is a crucial tool for investors who want to gauge a stock’s volatility and determine how much market risk they are taking on when investing in a particular security.
Understanding Beta can help investors make informed decisions by providing insights into how a stock might behave in different market conditions. Whether you’re a conservative investor seeking stability or a risk-taker looking for higher returns, Beta can be a useful indicator of which stocks align with your risk tolerance.
If you want to read same article in hindi click here
Definition of Beta
At its core, Beta measures the volatility or systematic risk of a stock relative to the overall market. A stock’s Beta shows how much it is likely to move compared to the market as a whole. The market is typically assigned a Beta of 1. Stocks with a Beta above 1 are considered more volatile, while those with a Beta below 1 are seen as less volatile.
For example, if a stock has a Beta of 1.5, it means the stock tends to move 50% more than the overall market. So, if the market goes up by 10%, the stock could rise by 15%, but if the market drops by 10%, the stock could fall by 15%.
How Beta is Calculated

The formula for Beta is relatively straightforward:
[
\text{Beta (β)} = \frac{\text{Covariance of stock and market returns}}{\text{Variance of market returns}}
]
Where:
- Covariance measures how the returns of the stock and the market move together.
- Variance represents the volatility of the market.
This formula calculates how much a stock’s price movements are correlated with the market’s overall movements. Historical data is typically used for these calculations, meaning that Beta reflects past price behavior rather than future expectations.
Interpreting Beta Values
The Beta value of a stock gives investors a clear sense of its risk profile relative to the market. Here’s how to interpret the different ranges:
- Beta = 1: The stock’s volatility matches the market. If the market moves up or down by a certain percentage, the stock is expected to do the same.
- Beta > 1: The stock is more volatile than the market. A Beta of 1.5 means the stock is 50% more volatile, while a Beta of 2 means it’s twice as volatile.
- Beta < 1: The stock is less volatile than the market. A Beta of 0.5 suggests the stock will move half as much as the market.
- Negative Beta: Rare, but possible. A negative Beta means the stock moves inversely to the market, increasing when the market falls and decreasing when the market rises.
How Beta Reflects Market Volatility
One of Beta’s main functions is to show how sensitive a stock is to market volatility. Stocks with high Beta values tend to be more affected by overall market movements, both positively and negatively. For instance, high-Beta stocks might experience significant gains during bull markets but could suffer larger losses during bear markets.
Conversely, low-Beta stocks tend to be more stable. They won’t rise as much during market rallies but may hold their value better during downturns.
The Role of Beta in Risk Assessment
Investors often use Beta to assess the risk associated with a stock, particularly when considering how it will behave in relation to the market. High-Beta stocks are considered riskier, but they also offer the potential for higher returns. Low-Beta stocks, while safer, generally provide lower returns.
Beta is especially useful for those looking to align their investments with their personal risk tolerance. For example:
- Conservative investors may prefer low-Beta stocks to minimize risk.
- Aggressive investors might seek out high-Beta stocks to capitalize on higher potential returns.
Beta and Diversification
While Beta is helpful for analyzing individual stocks, it’s also useful for portfolio management. Investors can combine high- and low-Beta stocks to achieve diversification, balancing risk and return. A portfolio with a mix of Beta values can smooth out volatility and provide more stable returns over time.
For example, an investor might hold a mix of high-Beta tech stocks for growth potential and low-Beta utilities stocks for stability, balancing the portfolio’s overall risk.
How to Use Beta in Stock Selection
When choosing stocks, Beta can be an important factor in determining which securities align with your investment strategy. For example:
- High-Beta stocks are suitable for investors looking for growth and willing to accept more risk. These stocks typically offer higher returns in booming markets but can drop sharply in a downturn.
- Low-Beta stocks are ideal for risk-averse investors who prefer stability. These stocks won’t experience extreme price swings and tend to perform consistently over time, even in turbulent markets.
Advantages of Using Beta in Stock Analysis
There are several reasons investors rely on Beta for stock analysis:
- Risk measurement: Beta provides a quick snapshot of a stock’s volatility.
- Portfolio balancing: Beta helps investors manage risk through diversification.
- Predicting price movements: Beta allows investors to gauge how a stock might respond to market changes.
Limitations of Beta
Despite its usefulness, Beta has some limitations:
- Past performance: Beta is based on historical data, which may not predict future volatility.
- Limited scope: Beta only accounts for systematic risk (market-related risk) and does not capture unsystematic risk (company-specific risk).
- Static measure: Beta assumes that a stock’s relationship with the market is constant, which might not be the case.
Beta in Different Market Conditions
Beta behaves differently depending on market conditions. In bull markets, high-Beta stocks tend to outperform as investors are more willing to take risks. Conversely, in bear markets, these stocks may underperform due to their higher volatility.
Low-Beta stocks, on the other hand, may not rise as much in bull markets but tend to hold up better during downturns, making them appealing to conservative investors.
Using Beta with the Capital Asset Pricing Model (CAPM)
Beta is a critical component of the Capital Asset Pricing Model (CAPM), which calculates an asset’s expected return based on its Beta and the market’s risk premium. The CAPM formula is:
[
\text{Expected Return} = R_f + \beta (R_m – R_f)
]
Where:
- R_f is the risk-free rate (like government bonds)
- β is the stock’s Beta
- R_m is the market return
CAPM helps investors determine whether a stock’s return justifies its risk, making Beta a vital input in this analysis.
Real-World Examples of Beta in Stock Analysis
In practice, high-growth tech companies like Tesla or Amazon often have higher Betas, reflecting their greater volatility and growth potential. Conversely, companies in more stable industries, like utilities or consumer staples, tend to have lower Betas.
For instance:
- **
Tesla**: A high-Beta stock, indicating substantial price swings.
- Coca-Cola: A low-Beta stock, known for its stability and consistent returns.
Beta vs. Other Risk Metrics
While Beta is helpful, it’s not the only measure of risk. Investors also use other metrics like standard deviation and alpha to get a fuller picture. Beta measures market-related risk, but standard deviation captures both market and company-specific risks.
Conclusion
In conclusion, Beta is a valuable tool for stock analysis that provides insight into a stock’s volatility relative to the market. Whether you’re seeking high-growth opportunities or more stable investments, understanding Beta can help you align your stock picks with your risk tolerance. However, it’s important to remember that Beta, while useful, has its limitations, and should be used in conjunction with other financial metrics for a comprehensive analysis.
What is Alpha in Investing and How to Calculate It
Frequently Asked Questions (FAQs)
- What does Beta represent in stock analysis?
Beta represents a stock’s volatility relative to the overall market, indicating how much the stock is likely to move compared to market changes. - What is considered a high Beta?
A Beta higher than 1 is considered high, meaning the stock is more volatile than the market. - How does Beta help with portfolio diversification?
Beta helps investors balance their portfolios by mixing high- and low-Beta stocks, spreading risk and providing more stable returns. - Can Beta predict future stock performance?
No, Beta is based on historical data and does not guarantee future performance. It should be used alongside other metrics. - What is the difference between Beta and standard deviation?
Beta measures market-related risk, while standard deviation captures both market and company-specific risks.


1 thought on “What is Beta and How to Use it in Stock Analysis”