Introduction
Investing in the stock market can feel very intense and hard to deal with. With so much information, how do you make smart decisions? One method investors use to predict future price movements is technical analysis. If you’re new to trading or just want to learn more about this approach, keep reading! By the end of this article, you’ll have a clearer understanding of what technical analysis is, how it works, and why so many traders rely on it.
If you want to read same article in hindi then click here
What is Technical Analysis?
It is a method of evaluating and forecasting future price movements based on historical market data, primarily price and volume. Unlike fundamental analysis, which focuses on a company’s financial health and intrinsic value, technical analysis only looks at the price action and uses that data to predict where the market might go.
The main idea behind technical analysis is that all relevant information is already reflected in the price. This means that you don’t need to analyze balance sheets or earnings reports; instead, you can focus on price patterns, trends, and indicators.
Fundamentals vs. Technical Analysis
So, what’s the difference between fundamental and technical analysis? Fundamental analysis involves studying a company’s financial health, including earnings, revenue, and industry conditions. It’s more suited for long-term investors who want to know the intrinsic value of an asset.
On the other hand, technical analysis ignores the underlying business. Instead, it focuses on short-term price movements and patterns, making it more appealing to traders looking for quicker returns.
How Technical Analysis Works
At its core, it revolves around supply and demand. Price movements happen because of changes in supply (sellers) and demand (buyers). When demand exceeds supply, prices rise, and when supply exceeds demand, prices fall. Technical analysts believe these movements are not random; instead, they form patterns that can be analyzed and used to forecast future prices.
The Importance of Charts

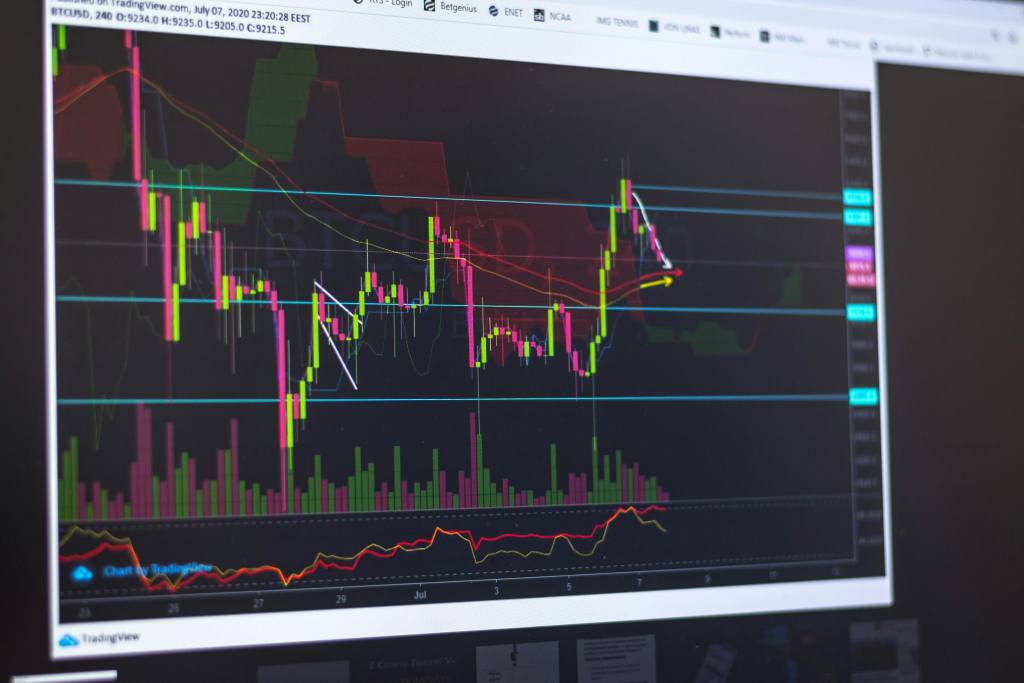
Charts are the backbone of technical analysis. By visually representing price movements, they help traders identify patterns and make predictions. There are different types of charts used in technical analysis, each with its advantages:
- Line Charts: Show closing prices over time.
- Bar Charts: Represent the open, high, low, and close prices for each period.
- Candlestick Charts: Provide the same information as bar charts but in a more visually appealing way, helping to spot trends faster.
Key Concepts of Technical Analysis
Support and Resistance Levels
Support levels are price points where a stock tends to find buying interest, preventing it from dropping further. On the flip side, resistance levels are where a stock faces selling pressure, preventing it from rising. Understanding these levels helps traders decide when to enter or exit a trade.
Trends and Trendlines
Trends are the general direction in which the market is moving. Trendlines are drawn on charts to connect price points and identify whether a market is trending up, down, or sideways. Identifying trends early allows traders to ride the wave of momentum.
Volume Analysis
Volume shows the number of shares or contracts traded in a given period. High volume often confirms that a price move is significant, while low volume can indicate a lack of conviction behind a movement.
Popular Technical Indicators
Moving Averages
Moving Averages smooth out price data to help identify trends. There are two main types:
- Simple Moving Average (SMA): An average of prices over a specific period.
- Exponential Moving Average (EMA): Places more weight on recent prices, making it more responsive to new information.
Relative Strength Index (RSI)
The RSI measures the speed and change of price movements. It ranges from 0 to 100, with readings above 70 considered overbought and below 30 considered oversold.
Moving Average Convergence Divergence (MACD)
The MACD is a trend-following momentum indicator that shows the relationship between two moving averages. It helps traders spot potential buy or sell signals.
Bollinger Bands
Bollinger Bands consist of a moving average and two standard deviations above and below it. They measure market volatility and can help traders predict price reversals.
Candlestick Patterns
Candlestick charts form the foundation of many technical trading strategies. Some common candlestick patterns include:
- Doji Candlestick: Indicates market indecision and potential trend reversal.
- Engulfing Pattern: Suggests a reversal in the current trend when the body of one candlestick fully engulfs the previous one.
Technical Analysis Tools
There are numerous tools and platforms available for technical analysis. Some popular ones include:
- TradingView
- MetaTrader
- ThinkorSwim
These platforms provide advanced charting, backtesting, and indicator tools to assist in decision-making.
Common Mistakes in Technical Analysis
One mistake traders make is overcomplicating analysis by using too many indicators. Another error is ignoring broader market trends and focusing too much on short-term movements. It’s essential to strike a balance and keep things simple.
The Role of Psychology in Technical Analysis
Market psychology plays a huge role in technical analysis. Patterns form because human emotions, like fear and greed, drive price movements. Understanding the psychology behind market movements can give you an edge.
Backtesting in Technical Analysis
Backtesting involves testing a trading strategy on historical data to see how it would have performed. It helps traders refine their strategies before risking real money.
Technical Analysis in Different Markets
Technical analysis works across different markets, including:
- Stocks: Traders use it to identify entry and exit points.
- Forex: It’s heavily relied on due to the high liquidity and round-the-clock trading.
- Cryptocurrency: As a new and volatile market, many traders use technical analysis for short-term gains.
Limitations of Technical Analysis
While technical analysis has many advantages, it’s not foolproof. It assumes that history repeats itself, which may not always be the case. Also, technical analysis works best in trending markets, but it can be less reliable during periods of consolidation or sudden news events.
Conclusion
Technical analysis is a powerful tool for traders, offering insights into market trends and potential price movements. However, it’s essential to combine it with other strategies, like fundamental analysis, to make well-rounded decisions. Remember, no analysis is 100% accurate, so always manage your risk!
What is Fundamental Analysis If you want to know more click here
FAQs
- Is technical analysis only useful for day traders?
No, technical analysis can be useful for both short-term traders and long-term investors. - Can I use technical analysis in cryptocurrency trading?
Yes, many traders use technical analysis in the highly volatile cryptocurrency market. - **What is the best technical indicator for beginners?**
Moving Averages and RSI are great starting points due to their simplicity. - Do I need special software for technical analysis?
While not necessary, specialized platforms like TradingView can enhance your analysis. - Is technical analysis better than fundamental analysis?
Both have their place, and many traders use a combination of the two for better results.


1 thought on “What is Technical Analysis ?”